AVAILABLE NOW

Make structure visible.

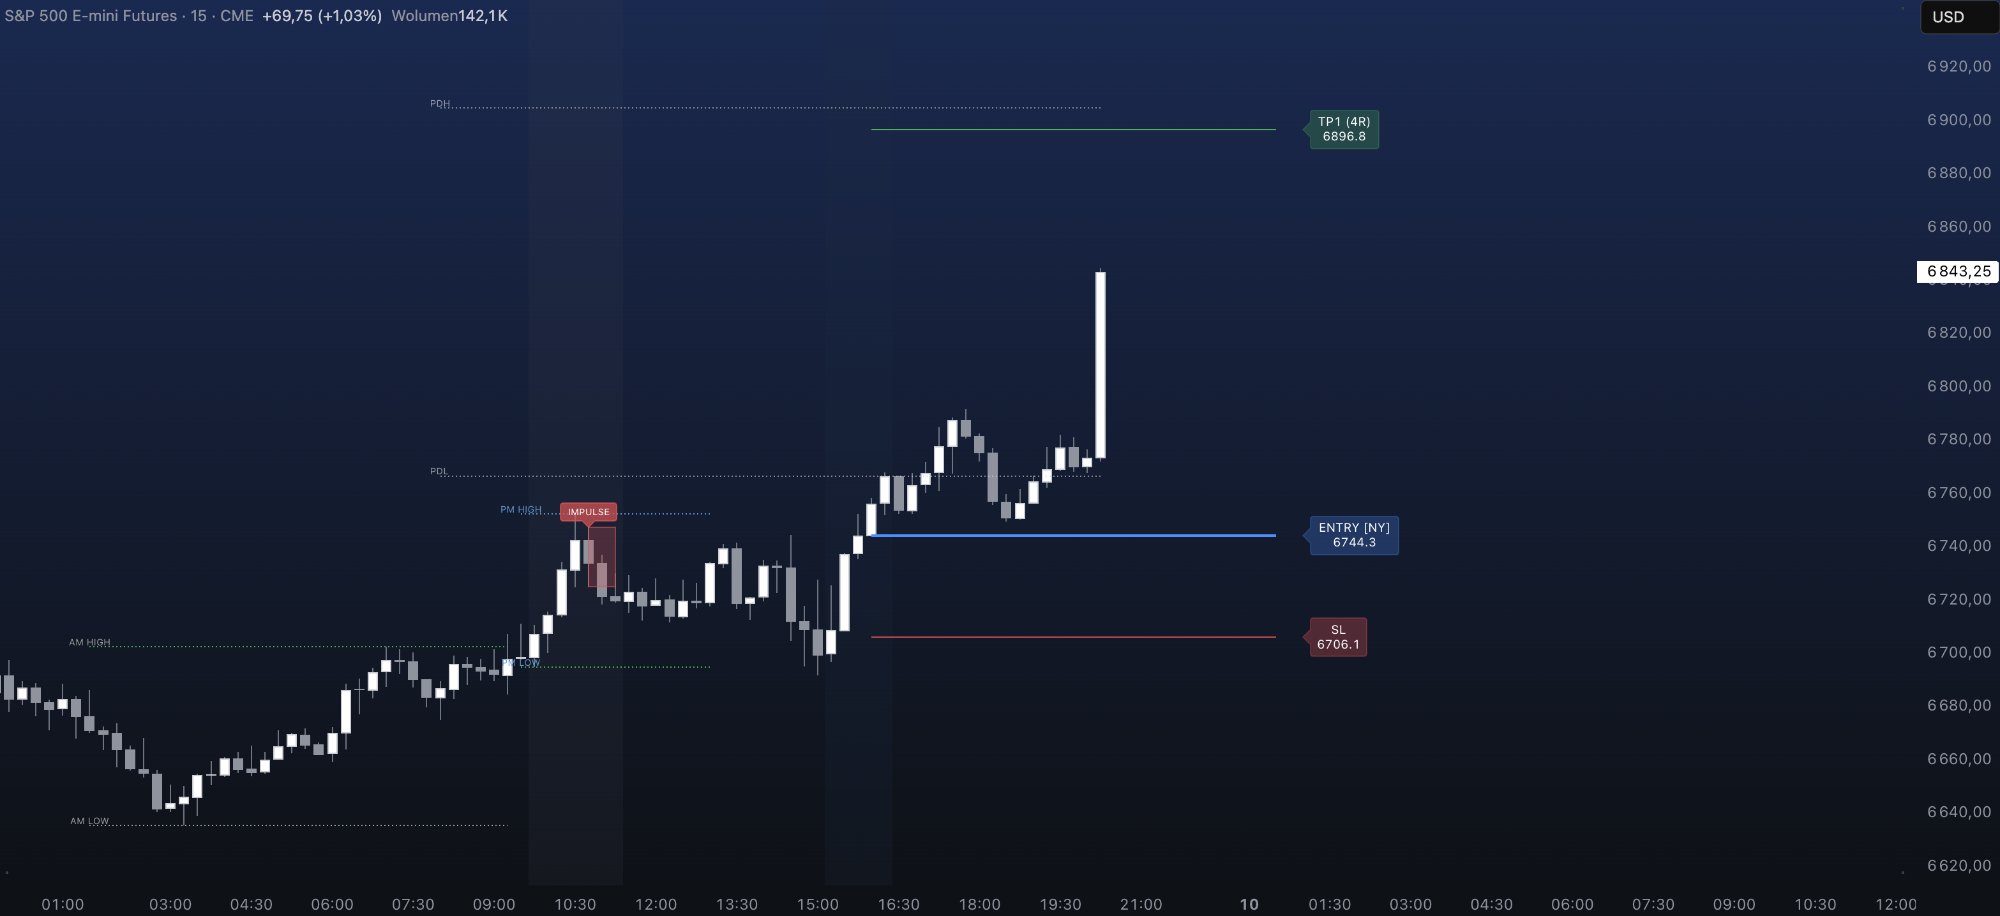
A TradingView indicator that maps market structure in real time. On your chart. No black box. No signals. Real-time  ·  No repaint  ·  No delay

Get Early Access

What you see
is what matters.

Nothing is drawn until the condition and validation is met.

Chart
Day of Week
Performance

Structured history.
Fully traceable.

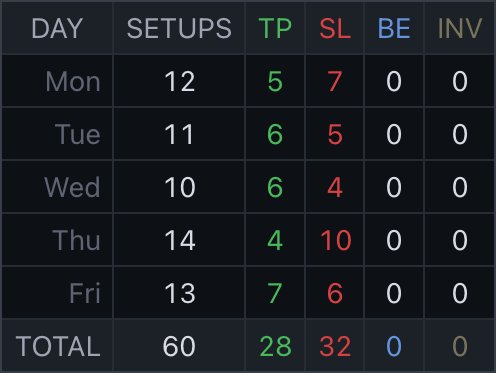
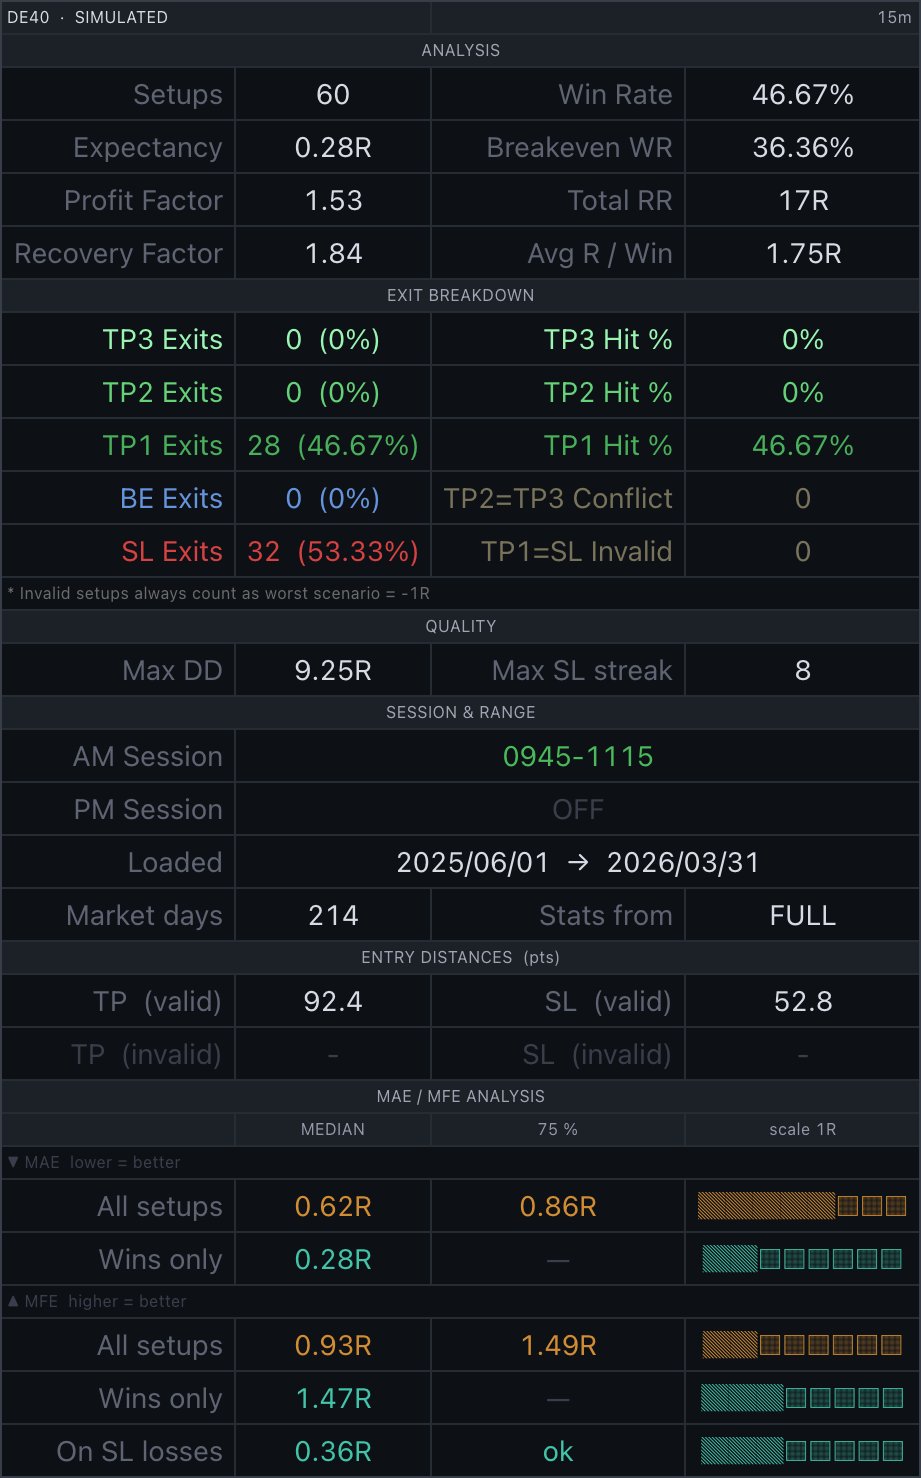
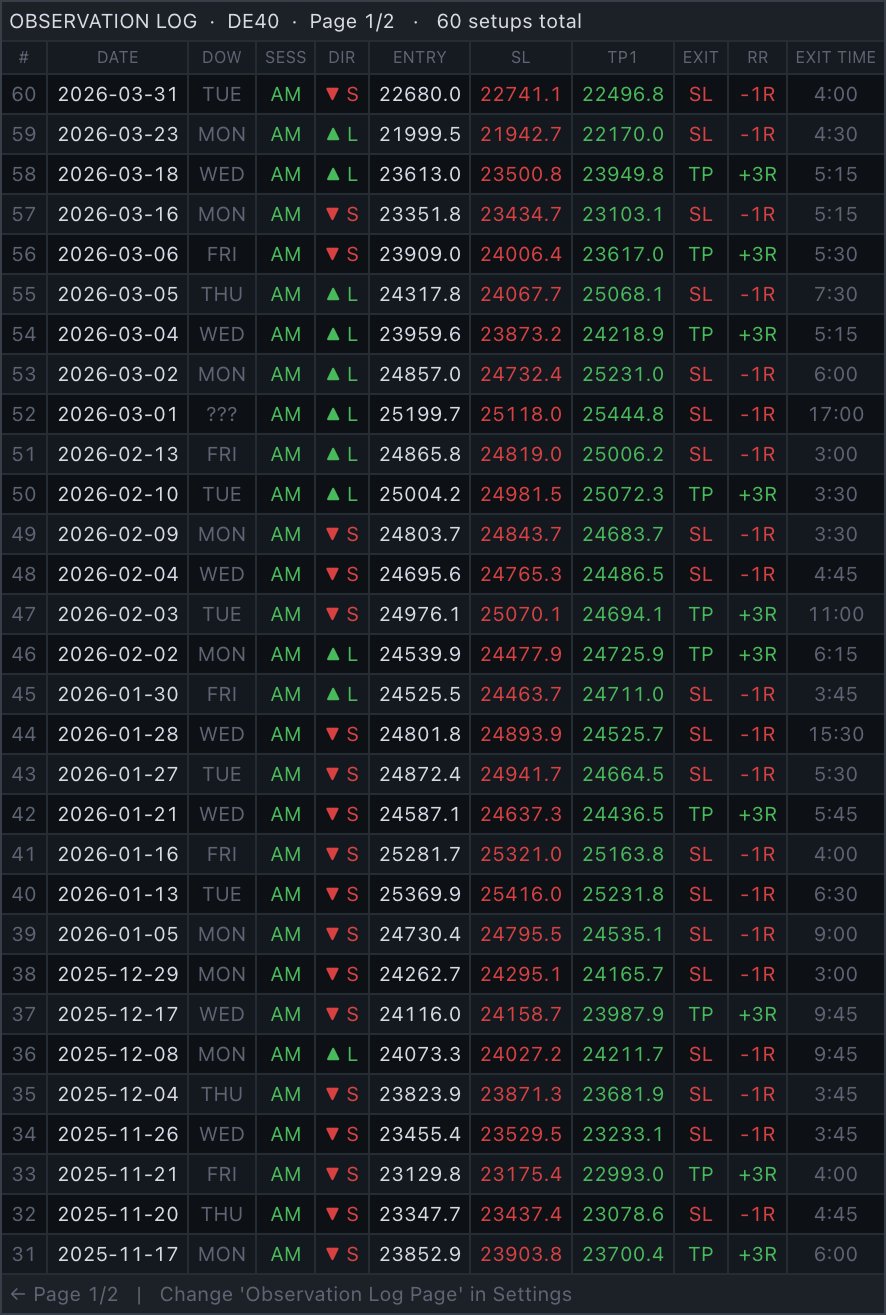
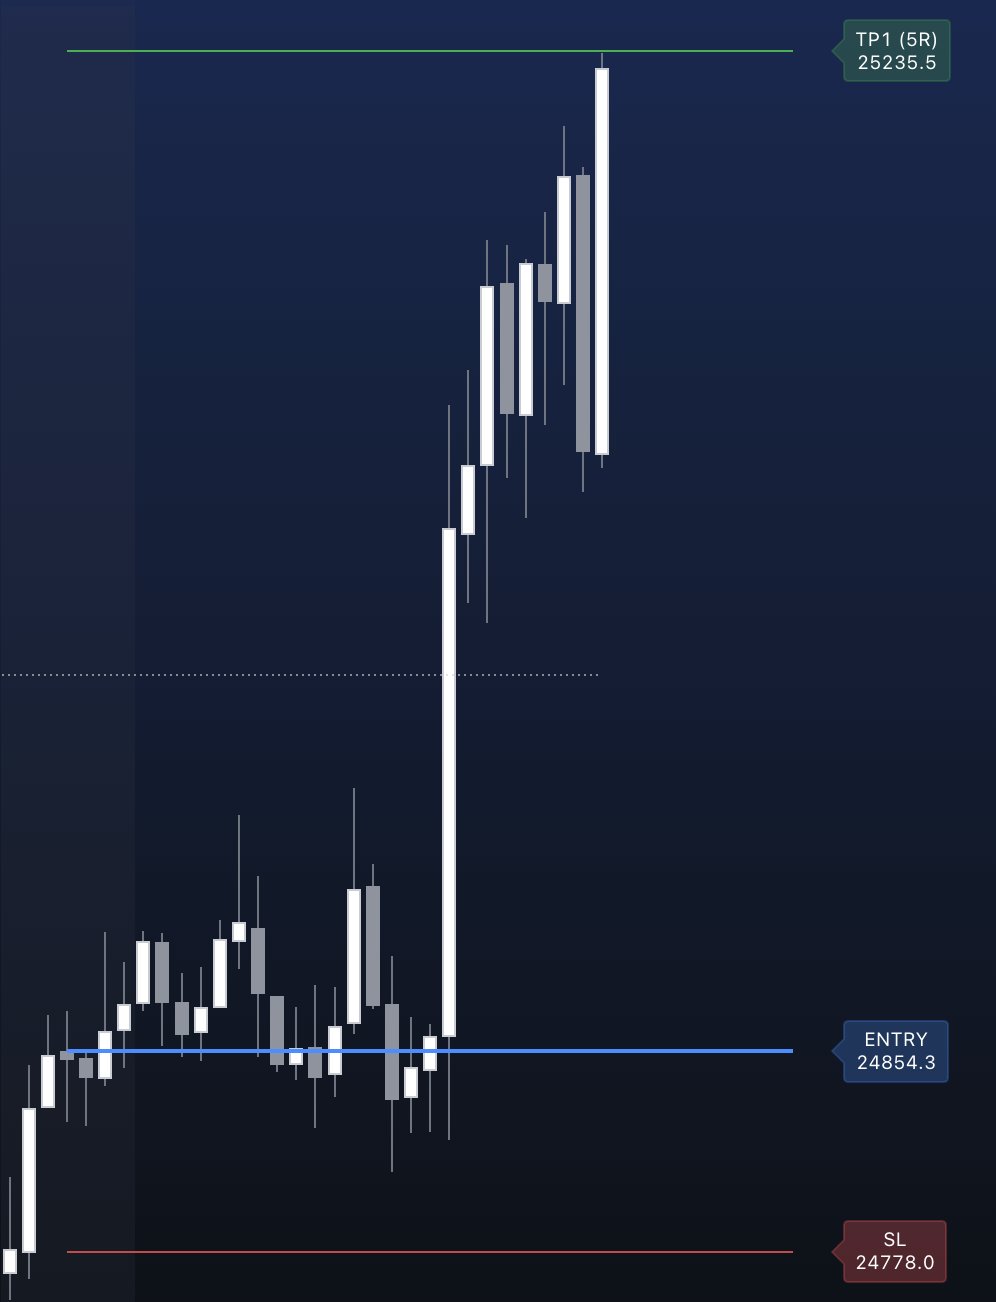
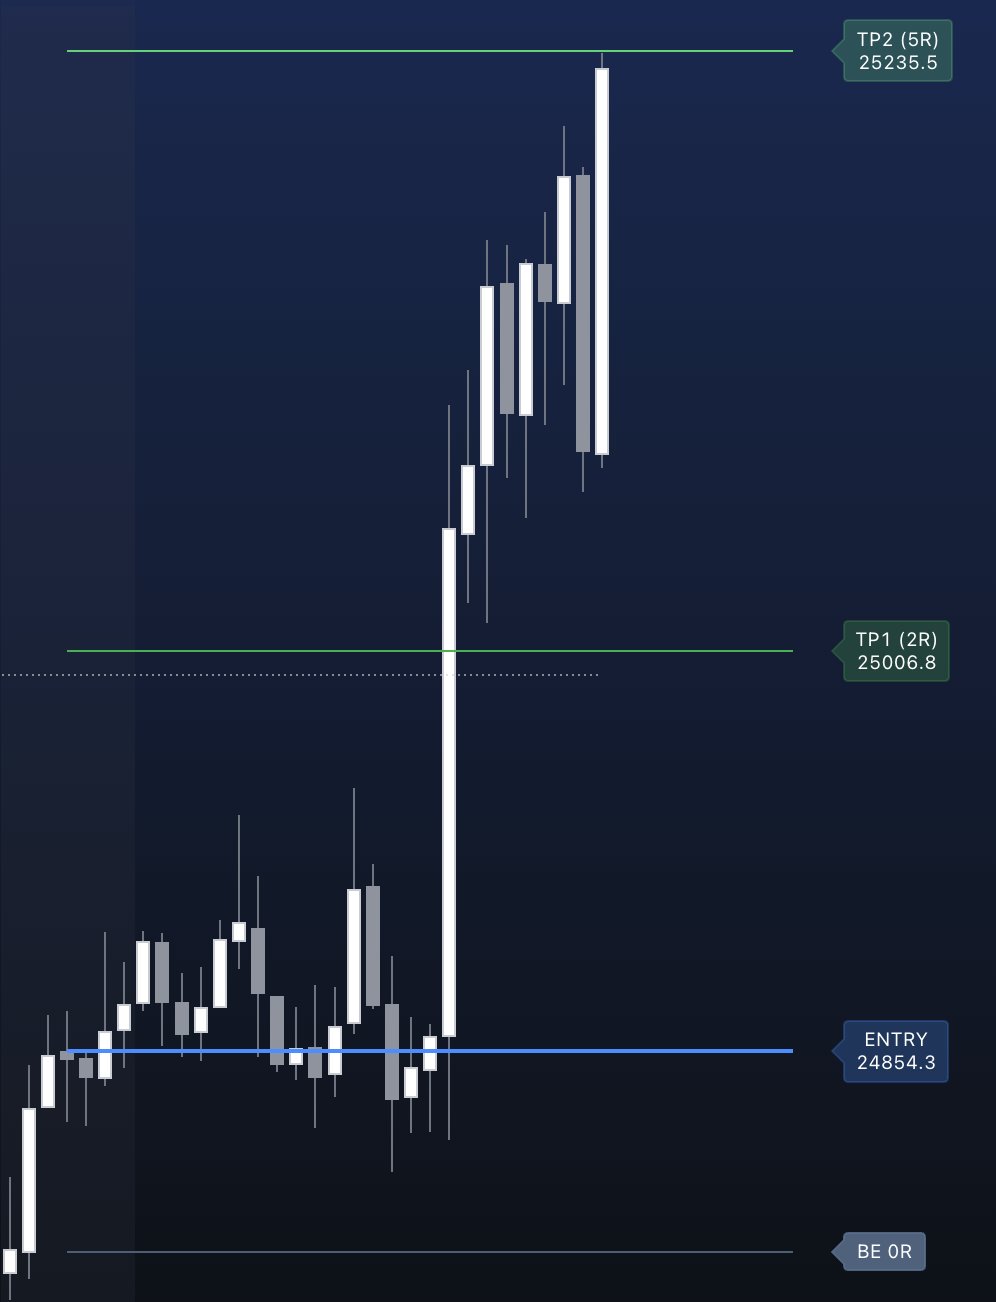
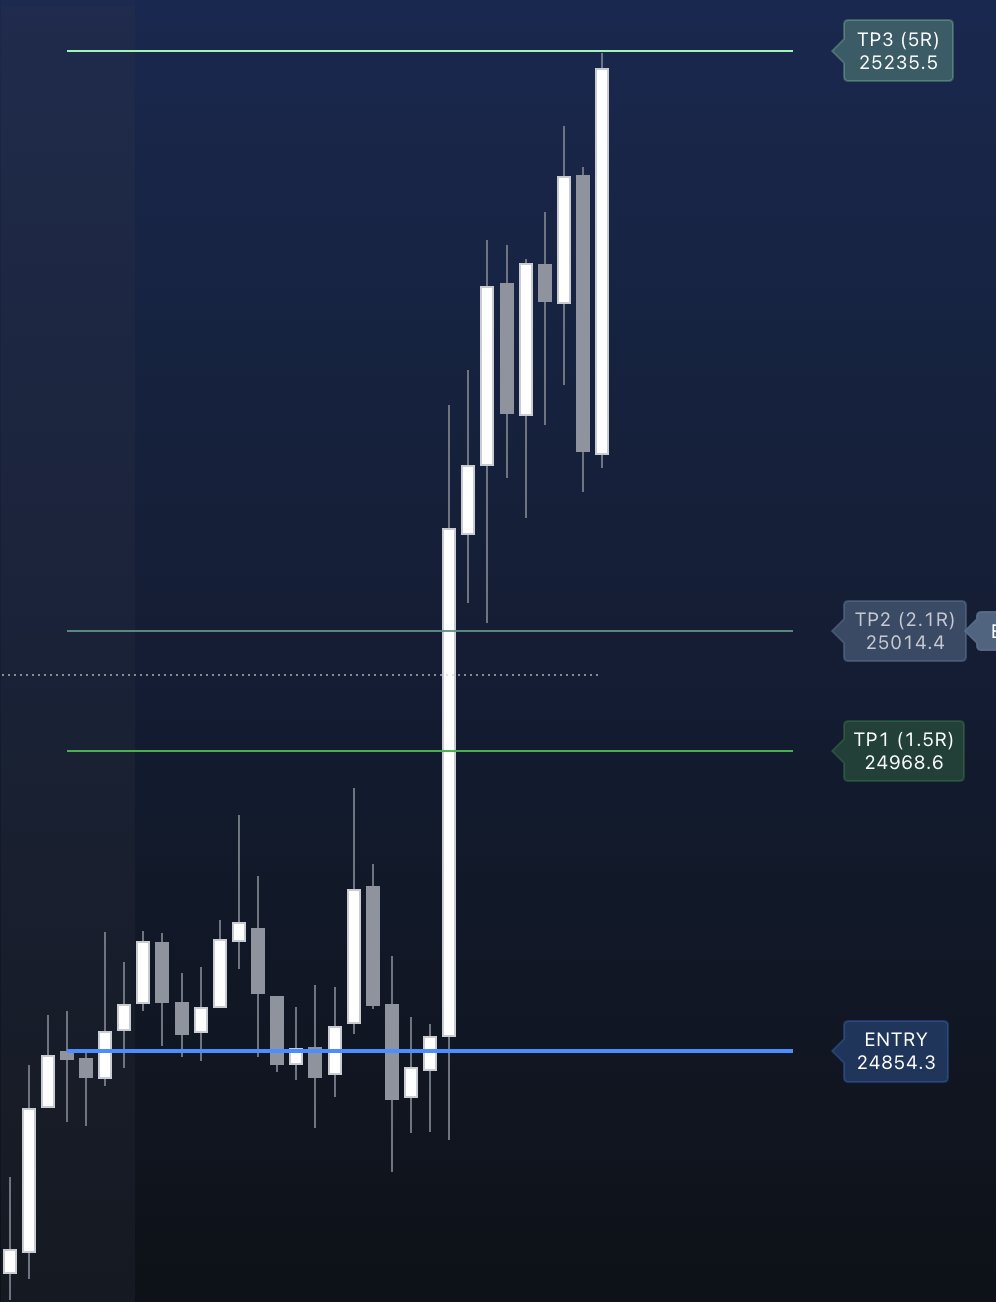
Every setup identified by the indicator is logged — with date, direction, levels, and outcome. Simulated. Non-predictive. Always in view.

Trade history chart
Observation Log

Four steps.
Structural context.

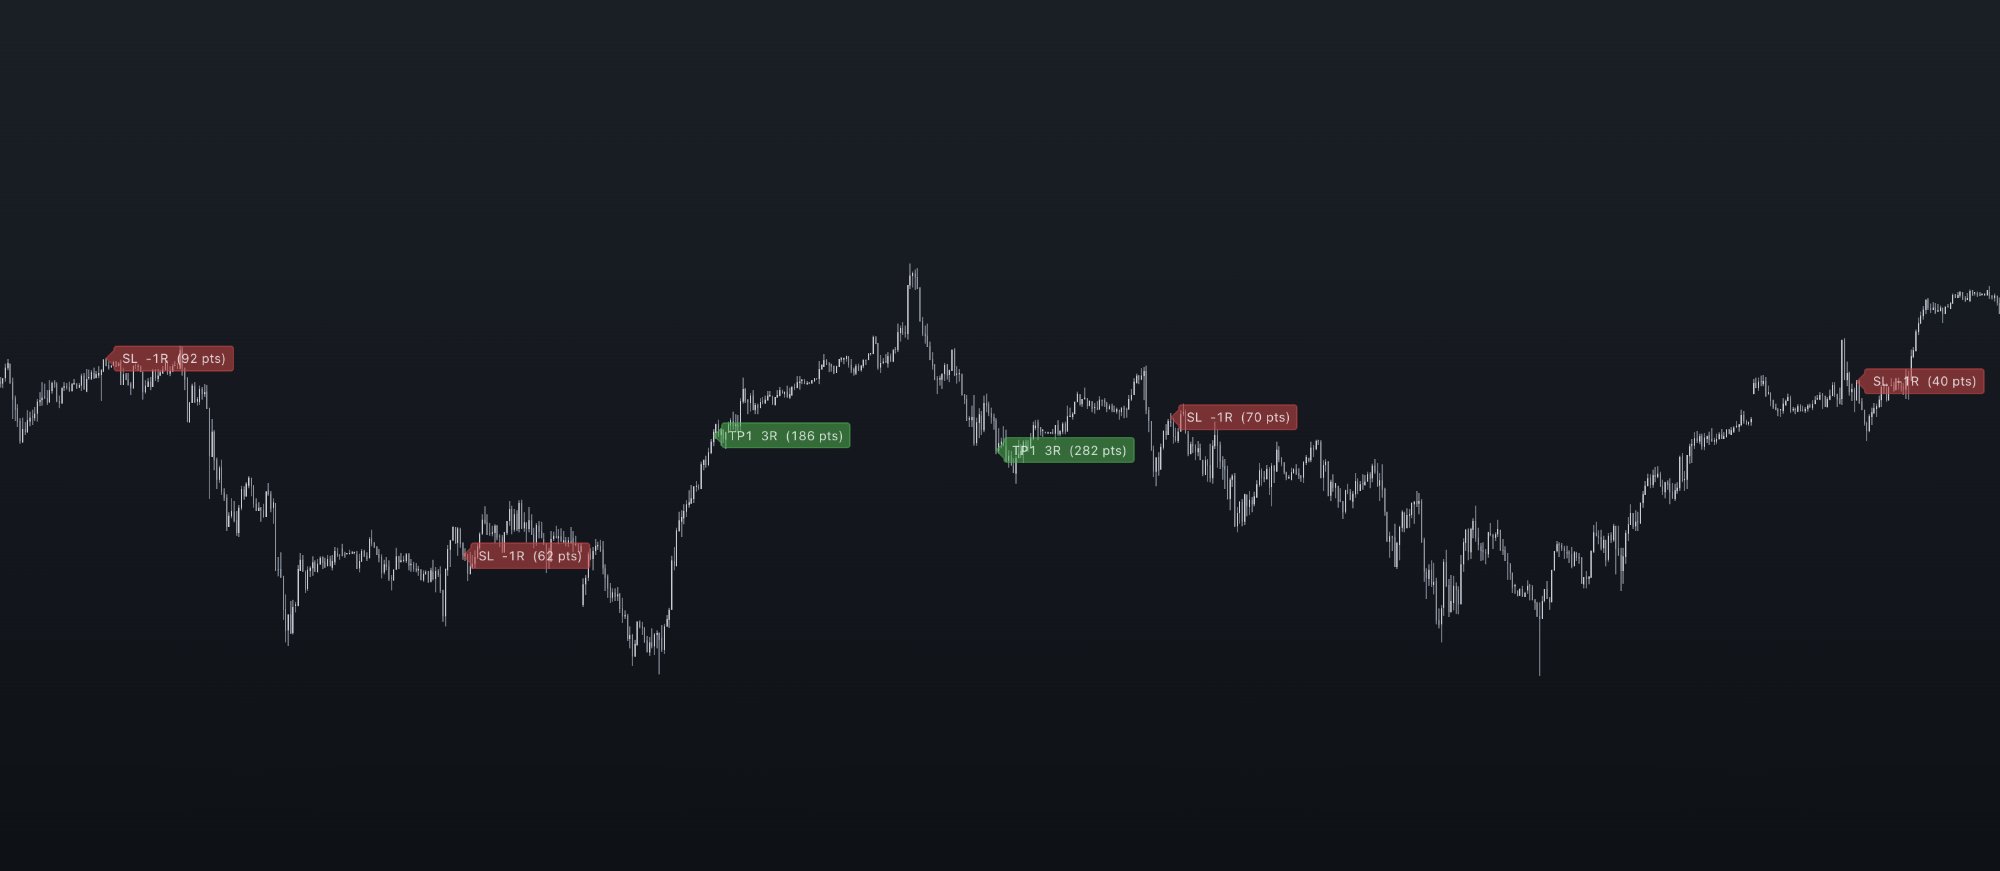
Algetris maps the structural sequence in real time. No black box. No signals. Just the market — read clearly.

Range
Set the range. Wait.
AM HIGH AM LOW
Sweep
Sweep detected. Now the market speaks.
Session Low SWEEP detected
Displacement
Impulse identified. Analysis continues.
Impulse range
Visualisation
If the structure aligns — the map is yours.
TP2 TP1 Entry SL

Depth of work.
Visible in the data.

Algetris can be applied to any liquid market with session-based behaviour. You can explore and build your own configurations — or start from the research we've prepared.

Analysis built on full-session data.To help you find a starting point for the tool — not the final answer.
OHLC
Raw data
SESSION
Segmentation
STRUCT
Mapping
STATS
Analysis
Bars
50K+
Configs
19K+
Sessions
16
Instruments
7
Update cycle
Q / 4
Instruments analysed
NQ ES DE40 BTC GOLD RTY CL
In development
SOL · · · · · ·
50K+
Full-session OHLC bars per instrument
TradingView M15 data · complete sessions only · AM & PM treated separately
19K+
Configurations backtested per instrument
Each = selected for structural consistency · not optimised for peak results
7
Instruments analysed to date
AM and PM sessions analysed separately · each has its own parameter set
Q / 4
Research refresh cycle
Rolling 12-month backtest window · updated quarterly · reflects recent market behaviour
Starting points, not conclusions. Each configuration is a backtested structural reference. They show what has been observed. They do not predict what will happen. Treat them as a baseline. Verify independently.

Same instrument. Same day.
Different structure.

AM and PM sessions often behave differently — even on the same day.

Dual Independent Engines in One Tool
AM Session Engine
Morning structure
RANGE SWEEP DISPLACEMENT LEVELS
Configurable window. Separate parameter set. AM market behaviour analysed on its own historical data — independent of PM.
PM Session Engine
Afternoon structure
RANGE SWEEP DISPLACEMENT LEVELS
Different window. Different parameter set. PM sequences often resolve at different levels and within different structural conditions than AM.

Advanced targeting
logic.

Three independent configurations. Visualised levels only — for structural market understanding.

Step 1
Structure
identified
Step 2
Sequence
unfolds
Decision
Resolution path
mapped
Output
Levels
visualised
Mode 01
Single Target
ENTRY → TP1
Mode 1
Single target. TP1 defines the primary structural level. Sequence resolves at the first objective.
Mode 02
Scaled Exit
ENTRY → TP1 → BE → TP2
Mode 2
Two targets. TP1 defines the initial level, with BE triggered after price touch. TP2 extends the structure within the same sequence.
Mode 03
Extended Target
ENTRY → TP1 → BE → TP2 → BE → TP3
Mode 3
Three targets. TP1 defines the first level with BE after touch. TP2 confirms continuation, with BE2 activated after a candle close above the level. TP3 represents the full structural extension.

Is this how
you trade?

Algetris is built around one idea — understanding market structure through observation, not prediction.

If this sounds like you —
You make your own decisions — and want clearer context
You focus on specific sessions and consistency
You're comfortable working with a configurable tool
It may not be the right fit if —
You're looking for signals or alerts
You expect a tool to make decisions for you
You prefer a fully automated approach

Simple access.
Limited seats.

Will be delivered via TradingView once subscriptions are available. The indicator appears in your Invite-Only Scripts tab.

Early Access
Subscriber
$99 / month
VAT added at checkout where applicable
Access is limited to 300 subscribers.
Access to the full version of the indicator
Access to the full analytics suite — Observation Log, Analysis Dashboard, Range Analytics, Day-of-Week table, MAE & MFE analytics
Access to research configurations for NQ, ES, DE40, GOLD, BTC, ETH, SOL · AM and PM sessions independently
Early access to new instruments as research is completed
Early access to quarterly instrument analysis updates
Monthly subscription · monthly billing · access renewed each month

Algetris is a technical analysis tool — not investment advice, not a signal service. Research configurations are based on historical simulation and do not represent real trades. Trading involves substantial risk of loss. Full risk disclosure →

Good questions
deserve answers.

What does Algetris do?
+
Algetris is a TradingView indicator that maps market structure in real time. It highlights key structural levels based on a defined sequence and records behaviour for analysis.
Does it generate buy/sell signals or alerts?
+
No. Algetris does not send alerts, signals, or notifications. It displays structural levels — all trading decisions remain fully yours.
Is this a strategy or an indicator?
+
An indicator. It uses TradingView's indicator() framework, does not execute trades, and does not connect to any broker.
Are the results real trading performance?
+
No. All statistics and research are based on simulated historical data and do not guarantee future results.
Can I cancel or get a refund?
+
Yes. You can cancel anytime. A 14-day refund applies to your first payment — once per account.